Quick Start Guide
1. Quick Start Guide
This guide covers the fastest way to get CompassVPN set up on your server.
Web Panel Method (Single Server Setup)
If you want to set up a single server with a user-friendly interface, the Web Panel method is recommended.
Run the following command on your server. It will clone the CompassVPN agent repository, change into the new directory, and start the configuration Web Panel:
git clone https://github.com/compassvpn/agent.git && cd agent && ./start_panel.shUsing the Web Panel
- After running the command above, the terminal will show the panel URL (
http://<your_server_ip>:5050). Access this URL in your web browser. - Once you have entered all your settings, click save, close & start button. This action will create or update the
env_fileon your server and start the agent automatically.
Note: If you have configured monitoring according to the Manager Setup Guide , allow about 5~10 minutes after the agent starts for metrics data to populate your Grafana dashboards.
This Web Panel simplifies the setup process and helps avoid configuration errors. Proceed to the Configuration Guide if you need detailed explanations of specific parameters you see in the Web Panel.
Automated Deployment with GitHub Actions (Multiple Servers)
If you need to deploy CompassVPN to multiple servers simultaneously or want to automate your deployment process, GitHub Actions is the recommended approach. This method is ideal for managing a fleet of VPN servers without needing to configure each one individually through the Web Panel.
Setting Up GitHub Actions
- Fork the CompassVPN agent repository to your GitHub account.
- Navigate to your repository’s Settings tab, then on the left menu, select Secrets and variables → Actions
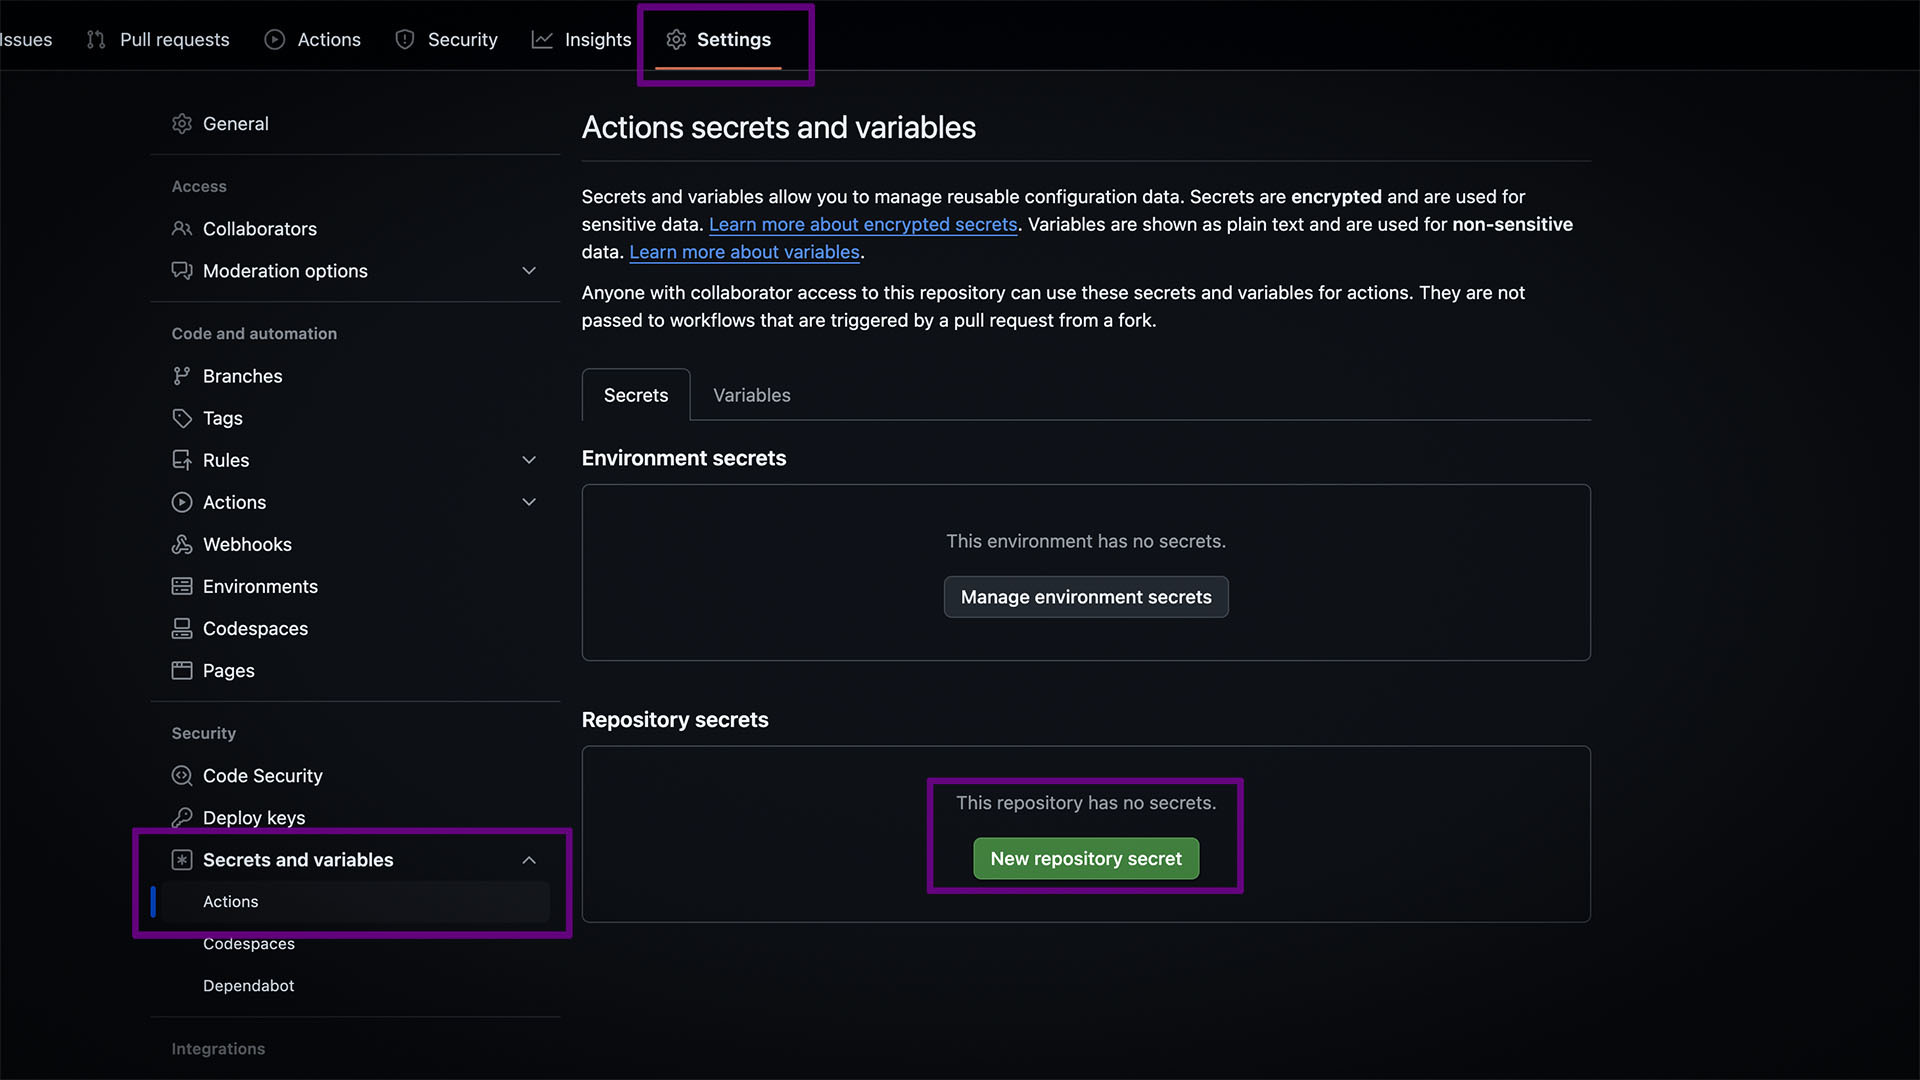
GitHub repository secrets configuration page
Authentication Methods
CompassVPN supports two authentication methods:
- Password Authentication: Use the format
username:password@ipin yourSERVERSvariable - SSH Key Authentication:
- Use the format
username@ipin yourSERVERSvariable - Provide your private key in the
SSH_KEYsecret variable
- Use the format
Recommendation: SSH key authentication is recommended for better security.
Important: You must use either password OR SSH key authentication for ALL servers. These methods cannot be mixed. If you want to use password authentication and have an SSH_KEY secret present, delete the SSH_KEY secret first.
- Set up the required secret variables:
Setting up SERVERS Secret
This variable contains the list of your servers, one per line, along with the authentication information.
For Regular SSH Password Authentication:
Add your servers in the format username:password@ip as shown below:
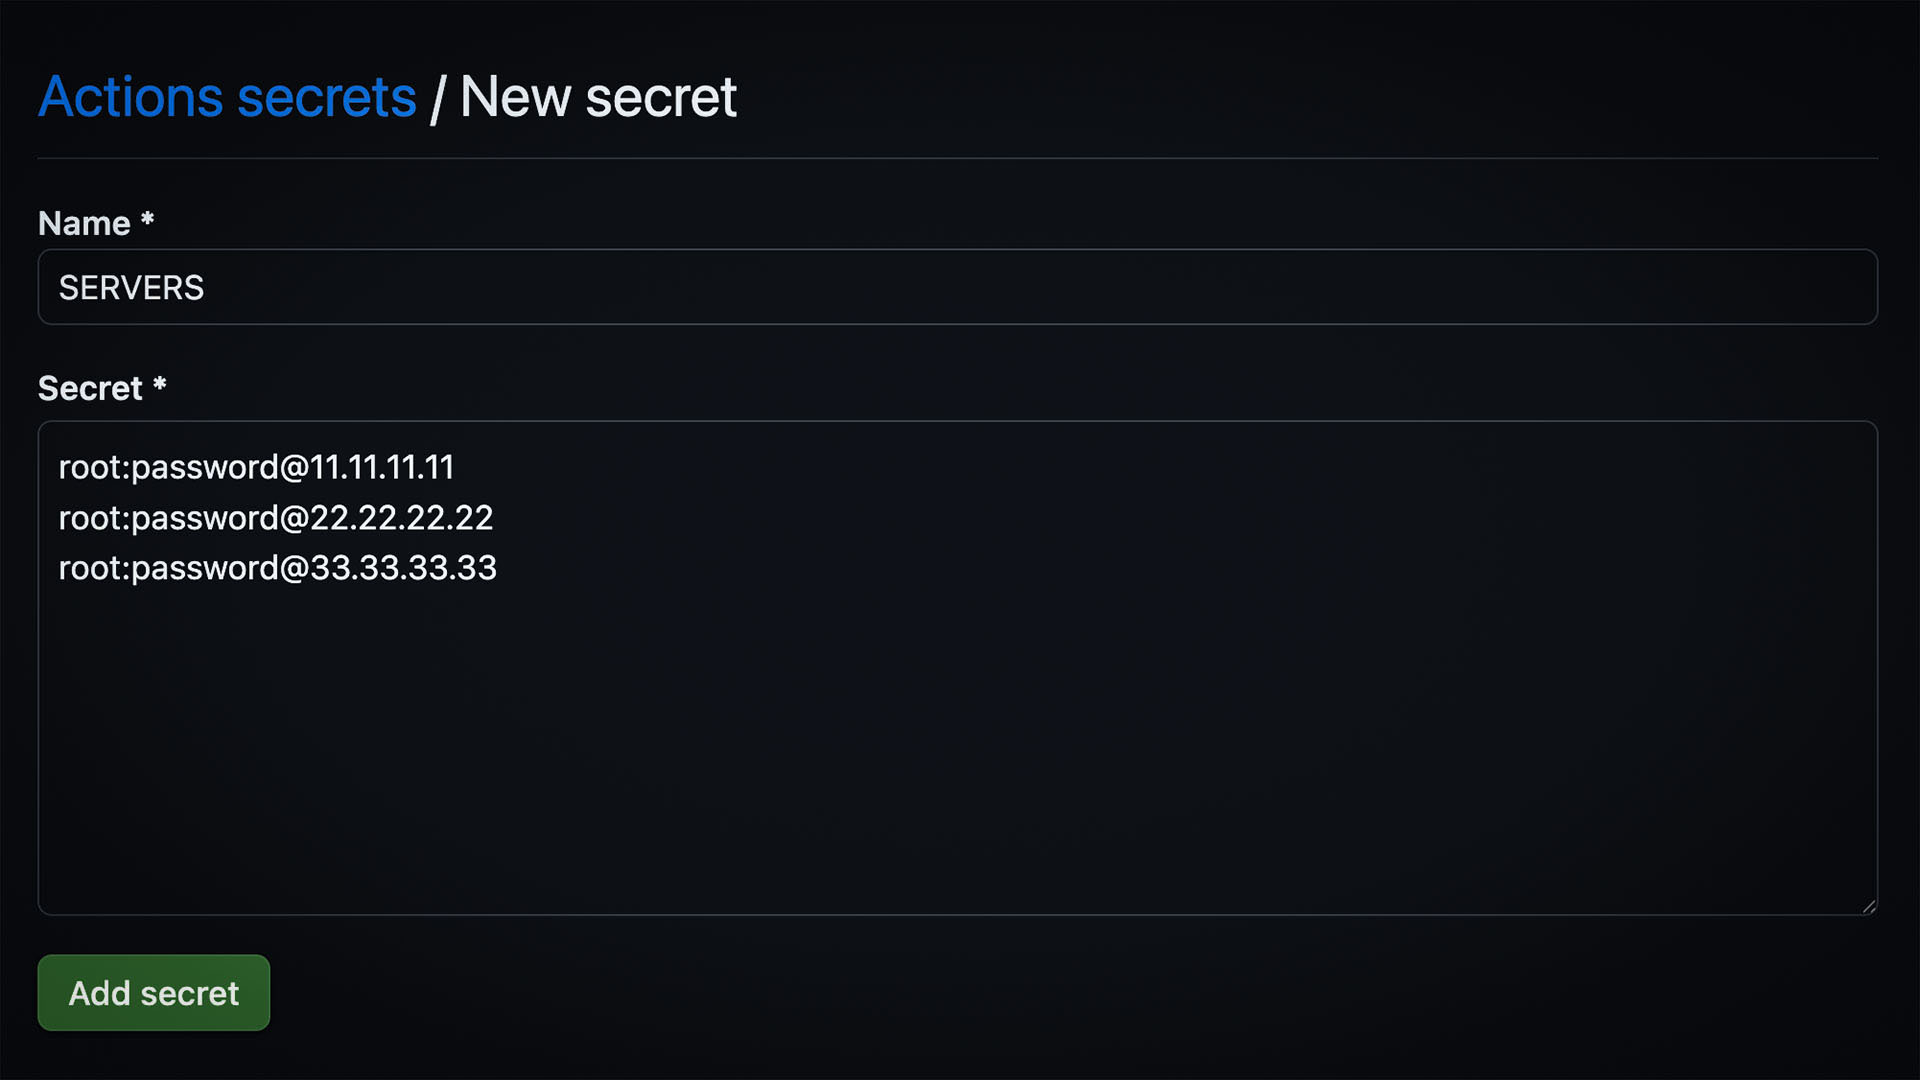
Setting up SERVERS secret for password authentication
For SSH Public Key Authentication:
Add your servers in the format username@ip as shown below:
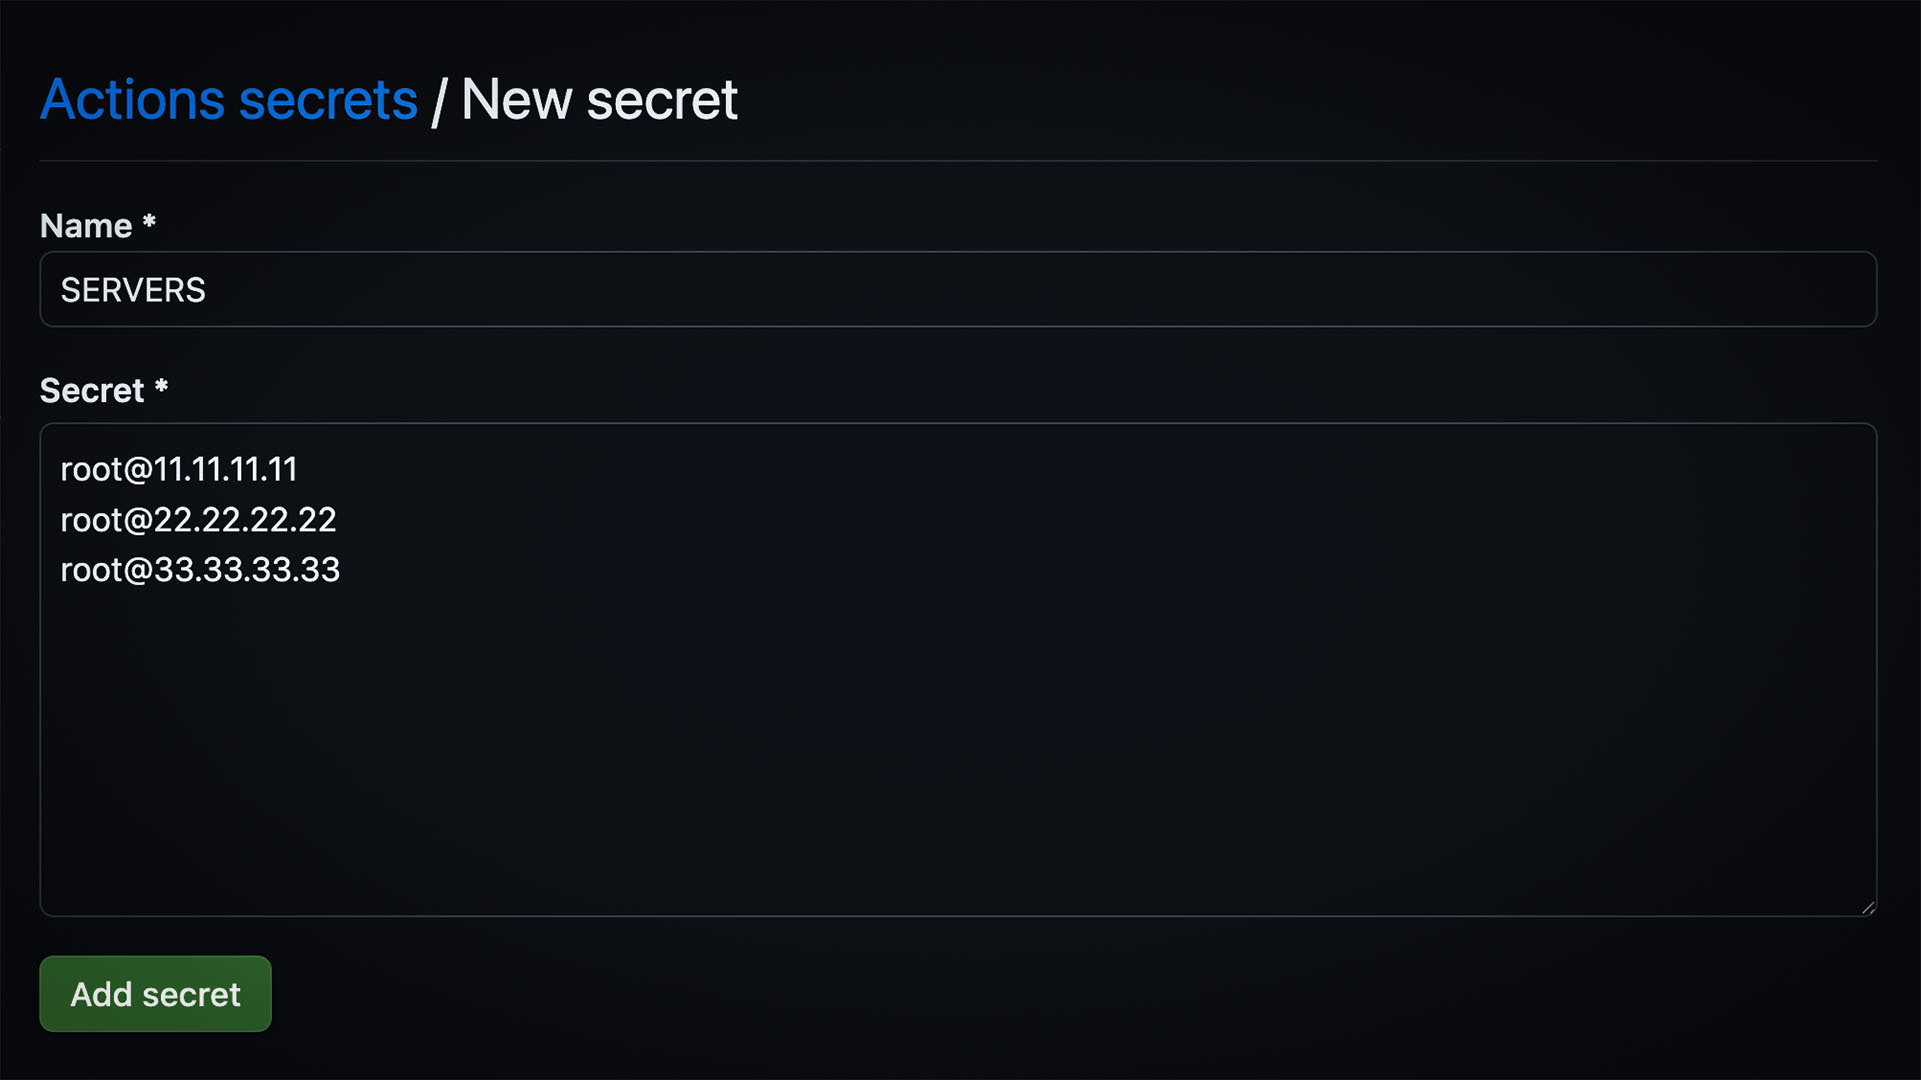
Setting up SERVERS secret for SSH key authentication
Setting up SSH_KEY Secret (for SSH key authentication)
If you’re using SSH key authentication, you’ll need to add your private SSH key in OpenSSH format:
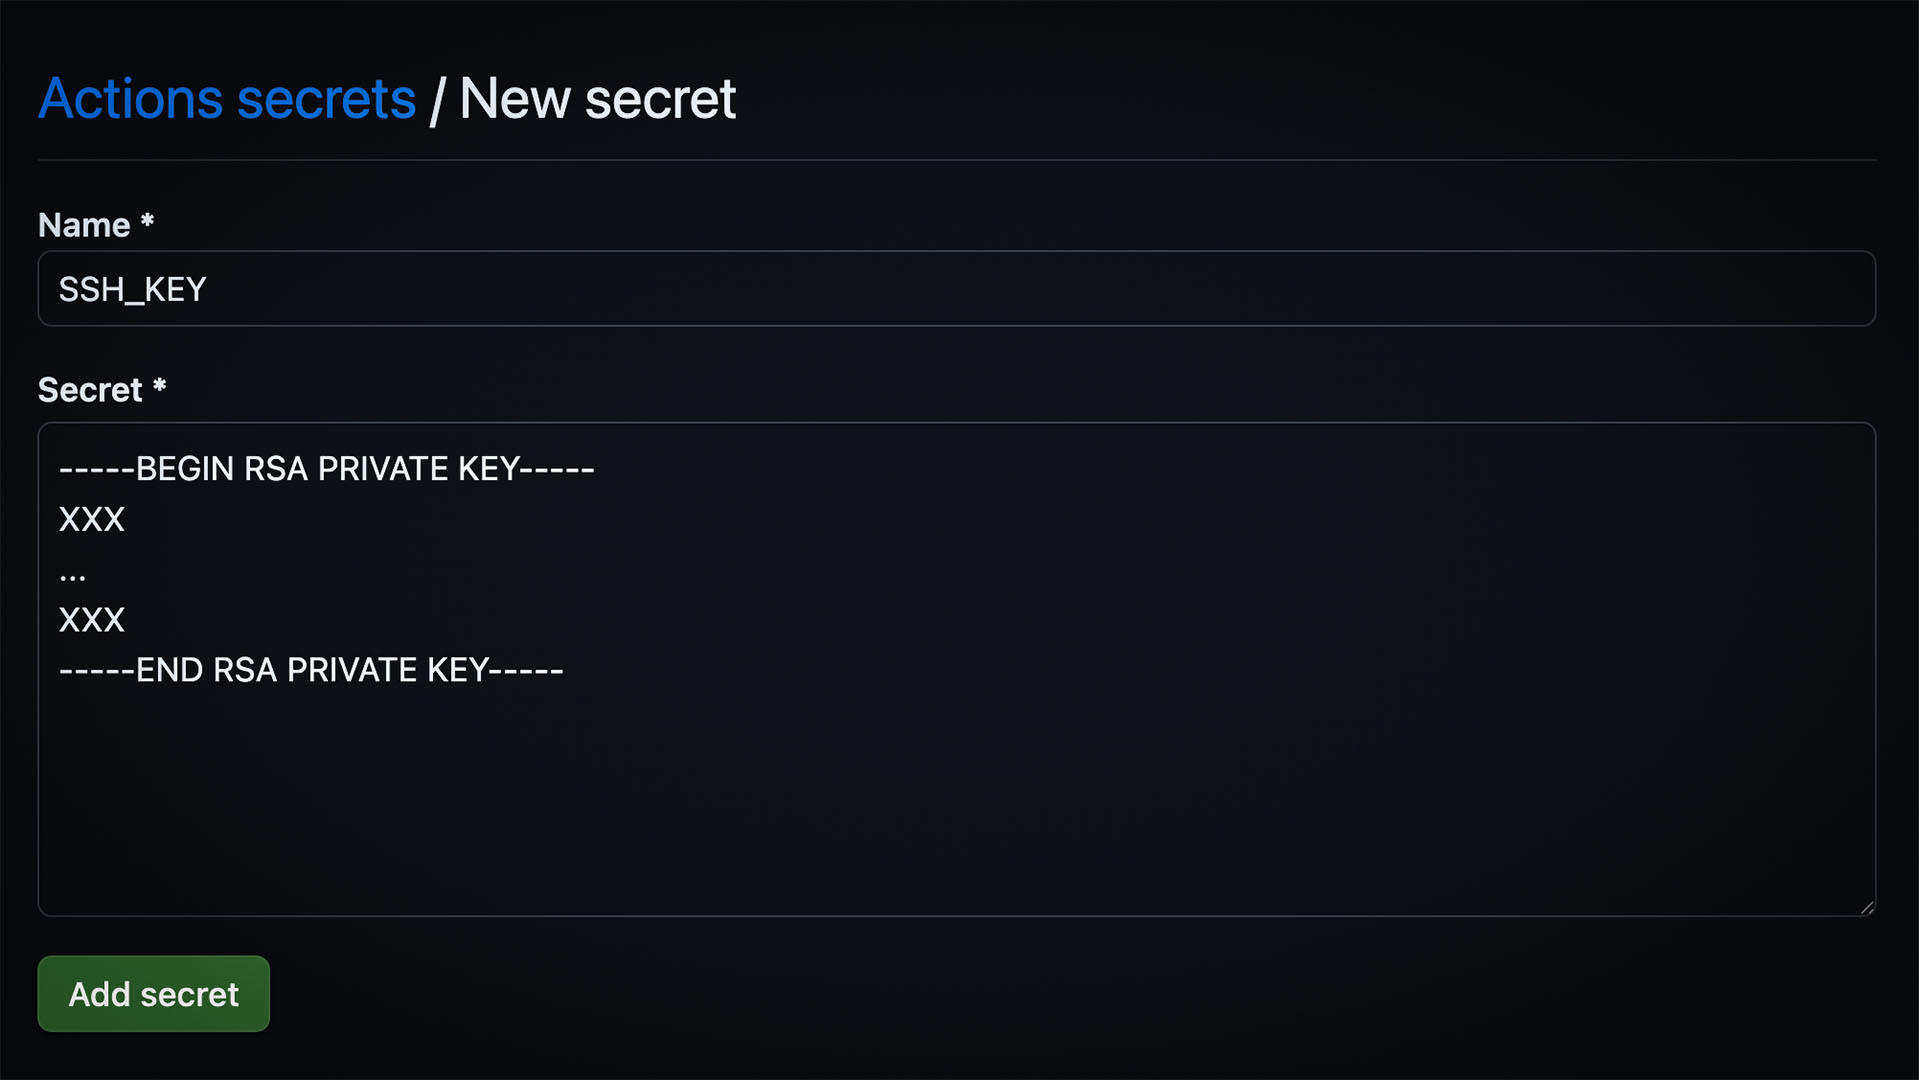
Setting up SSH_KEY secret with your private SSH key
Setting up ENV_FILE Secret
Important: The ENV_FILE contains your CompassVPN environment configuration and can be generated from the Web Panel. This file contains all the necessary settings for your VPN servers.
We recommend using the Web Panel at env.compassvpn.org to generate your ENV_FILE configuration. This ensures all required parameters are properly set.
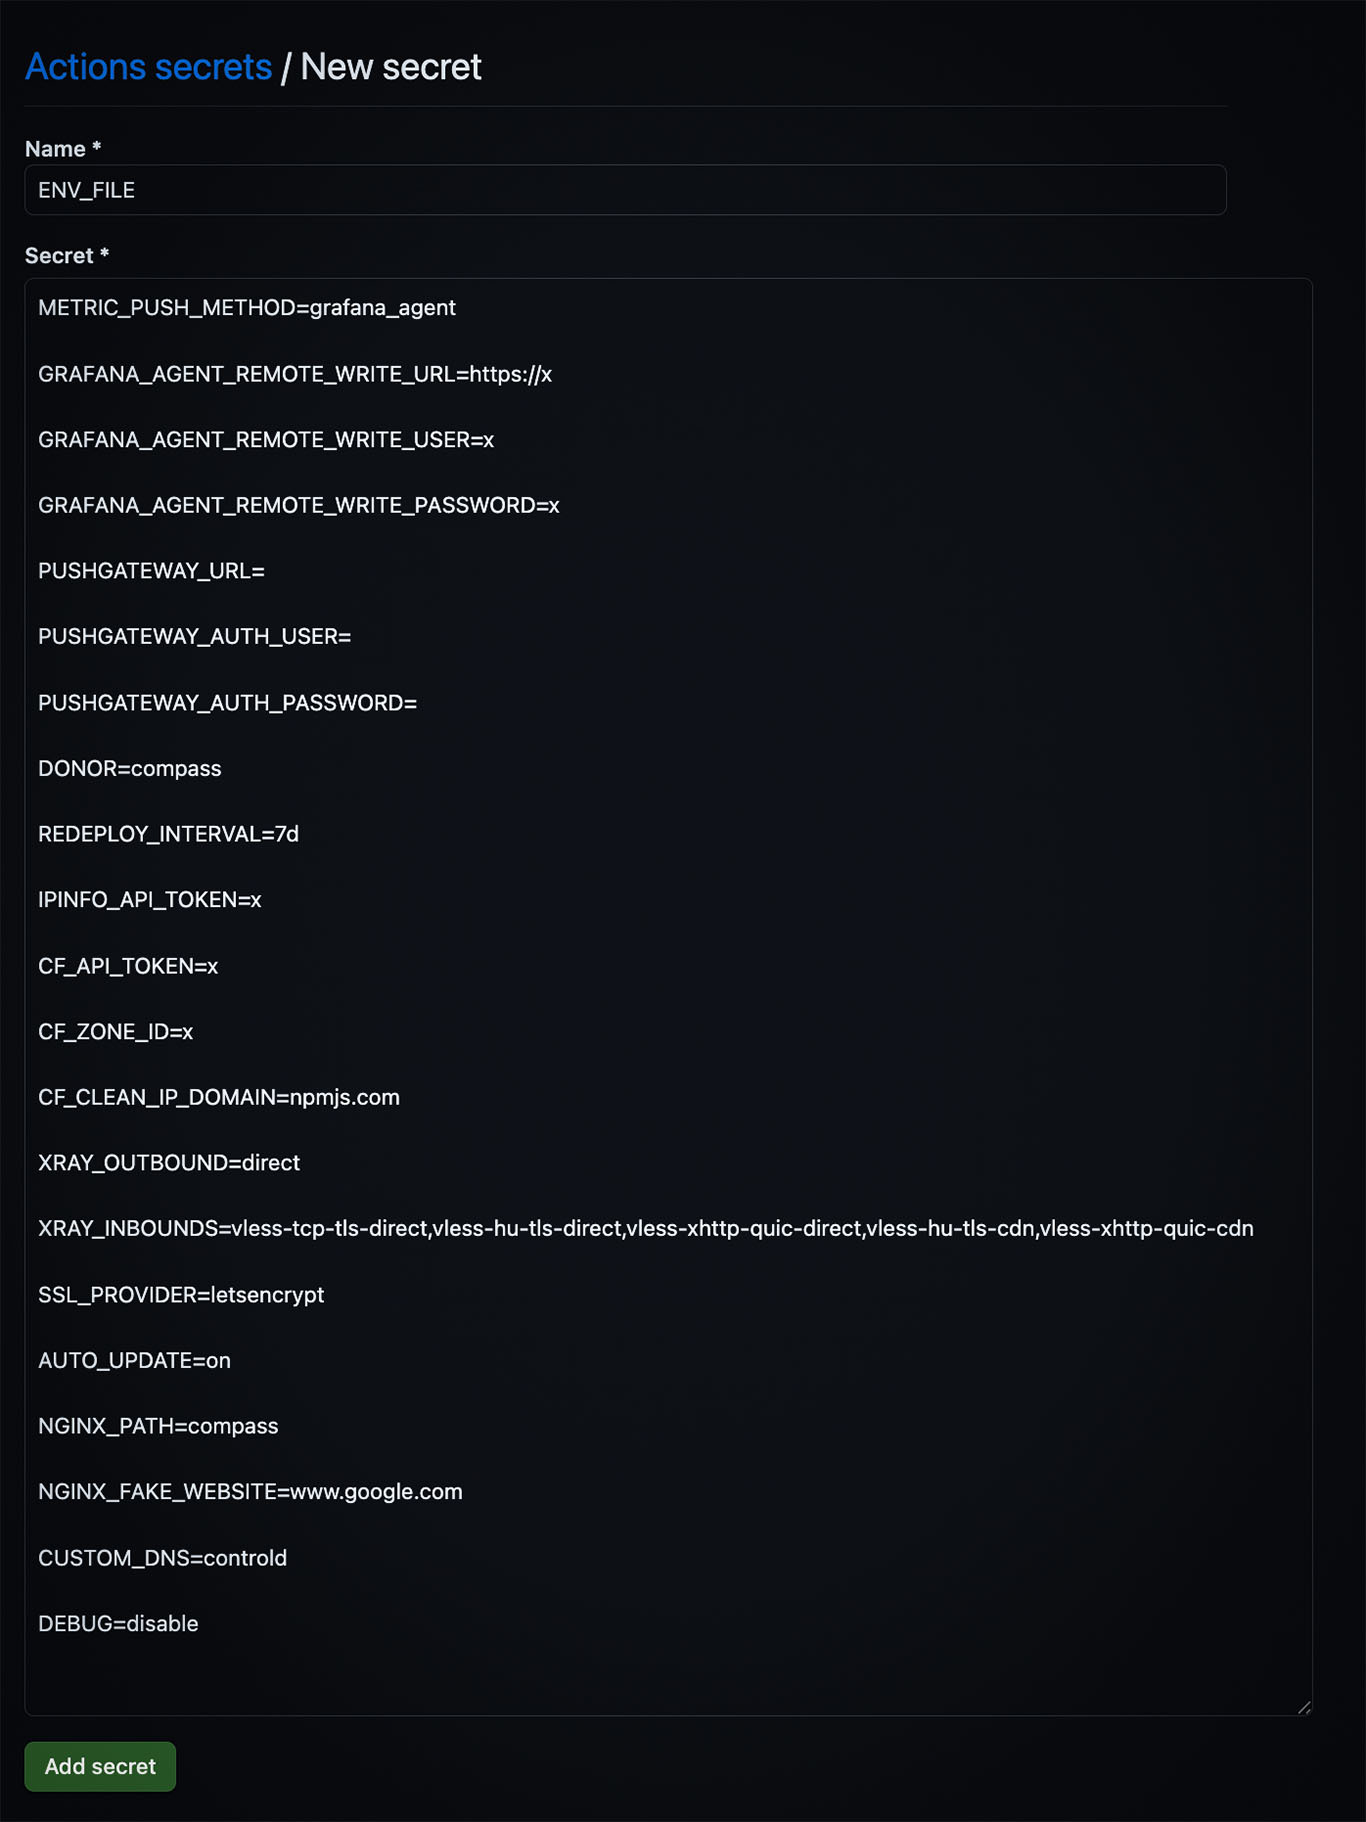
Setting up ENV_FILE secret with your configuration
Running the Workflow
Once you’ve set up all required secrets:
- Navigate to the Actions tab in your repository
- Select the Deployment workflow from the sidebar
- Click the Run workflow button
- Select the branch you want to deploy from (usually
main) - Click the green Run workflow button to start the deployment
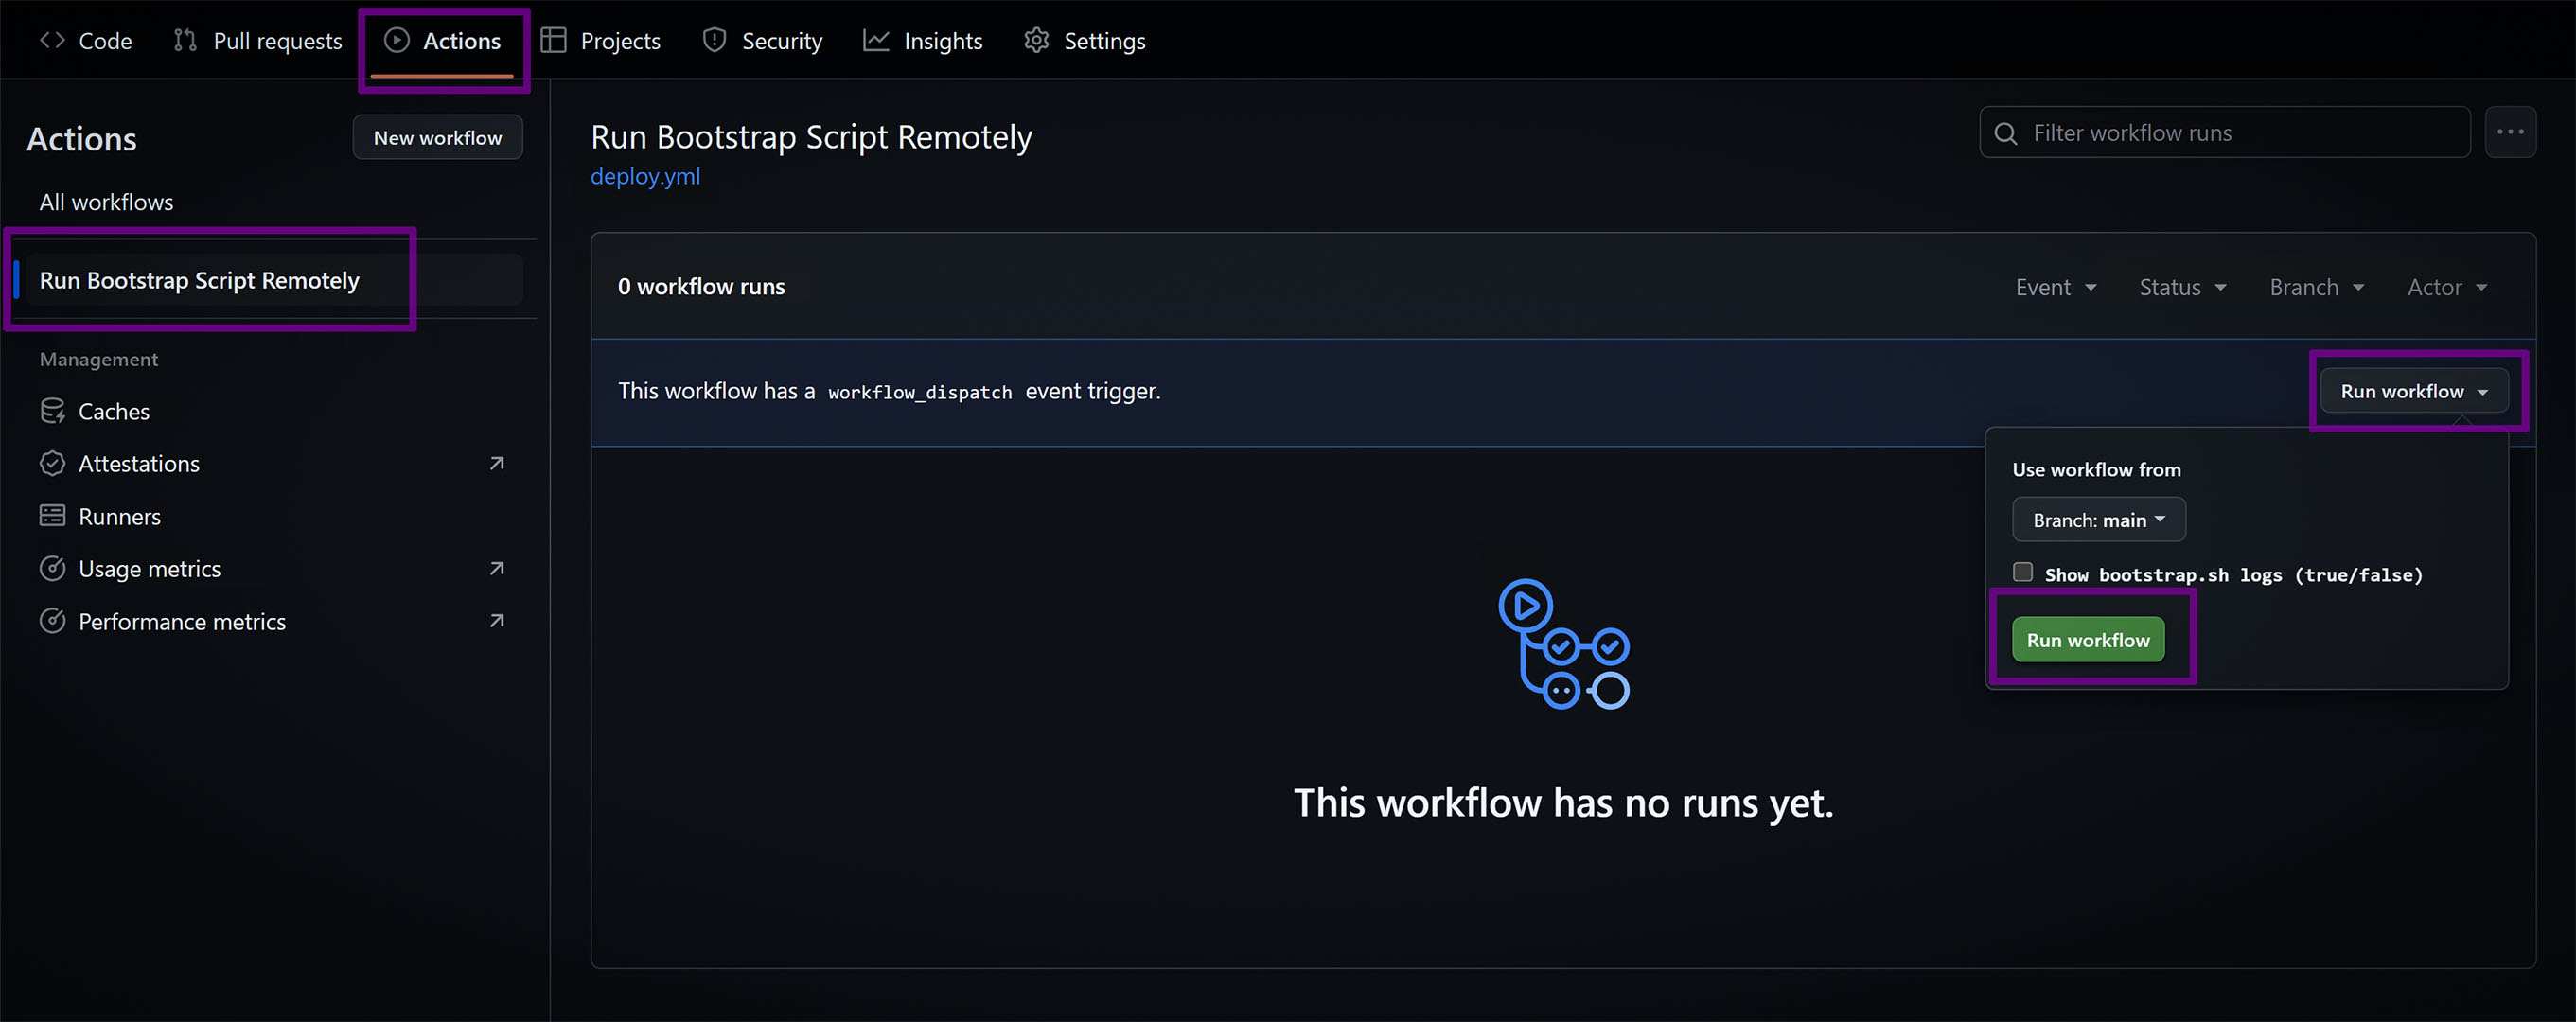
Run Workflow
The workflow will connect to each server in your SERVERS list and deploy CompassVPN with your configuration.
After deployment completes, you’ll need to import the dashboard to monitor your servers. Follow the instructions in the Manager Setup Guide - Step 4: Import Dashboards to set up your Grafana monitoring dashboard.
Important: After deployment completes, allow 10-20 minutes for all servers to initialize and begin reporting metrics fully. The setup time varies based on the number of servers and their connection speeds. You can monitor progress in the Actions tab and verify each server’s status in your Grafana dashboard.
This allows for consistent deployment across multiple servers and simplifies the management of your VPN infrastructure.