Monitoring
Your CompassVPN server reports its statistics to a personal dashboard that you can open from any browser: live connections, traffic, server health, and your shareable connection links. The standard setup uses Grafana Cloud: the free tier is more than enough, there is nothing to host or maintain, and it takes a few minutes to set up.
If you prefer to run your own monitoring stack, see Self-Hosted Prometheus and Grafana below.
Grafana Cloud
Step 1: Create a Grafana Cloud Account
- Go to Grafana Cloud and sign up for a free account
- Verify your email address and complete the registration process
Step 2: Create a Connection Token
After creating your account, go to the following URL (replace
<your-username>with your actual Grafana Cloud username):https://<your-username>.grafana.net/connections/add-new-connection/hmInstancePromIdCreate a new token as shown in the image below:
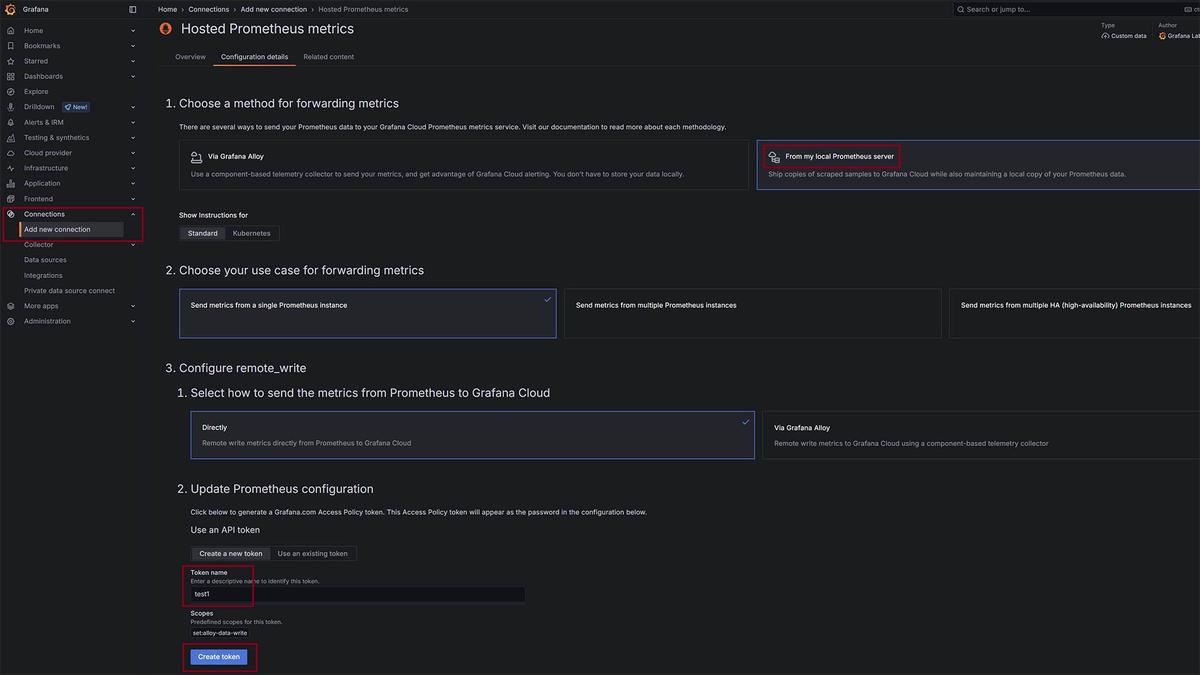
Figure 1: Creating a new connection token in Grafana Cloud. After creating the token, you’ll see three credentials as shown below:
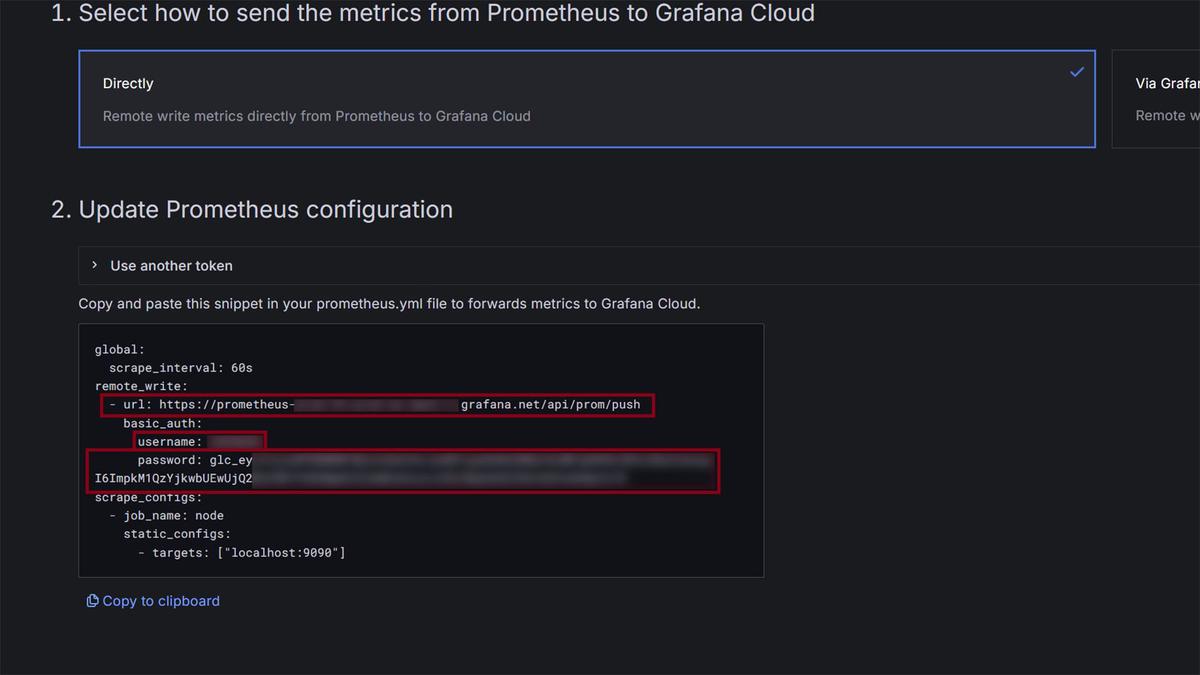
Figure 2: Copying the URL, username, and password credentials for agent configuration. Copy these three credentials:
- URL
- Username
- Password


Step 3: Add the Credentials to Your Agent
- Open the
env_filein the root of the agent directory (refer to the Quick Start guide if needed). - Set the three Alloy remote-write variables to the values you copied from Grafana Cloud:
ALLOY_REMOTE_WRITE_URLALLOY_REMOTE_WRITE_USERALLOY_REMOTE_WRITE_PASSWORD
- Apply the configuration by running
sudo ./agent.sh start.
For detailed explanations of all parameters, see the Configuration guide.
Step 4: Import the Dashboard
- In Grafana Cloud, navigate to Dashboards in the left sidebar
- Click the Import button
- Enter dashboard ID
23181(the CompassVPN dashboard, also available on grafana.com ) - Select your Prometheus data source and click Import
Self-Hosted Prometheus and Grafana
If you want complete control over your monitoring data, any Prometheus instance that accepts remote-write works in place of Grafana Cloud:
- Deploy Prometheus (with the remote-write receiver enabled and protected by basic auth) and Grafana. The Helm values the CompassVPN team uses on Kubernetes are available in the manager repository .
- In your agent’s
env_file, setALLOY_REMOTE_WRITE_URLto your Prometheus remote-write URL andALLOY_REMOTE_WRITE_USER/ALLOY_REMOTE_WRITE_PASSWORDto your basic-auth credentials, then runsudo ./agent.sh start. - In Grafana, import dashboard ID
23181and select your Prometheus data source.
Monitoring Multiple Agents
Any number of agents can report to the same endpoint. Each agent is identified by the DONOR value in its env_file; use the DONOR label as a filter variable in the dashboard to tell them apart.
Next Steps
Your CompassVPN installation is now complete. To connect client devices, see the User Guide .