Manager Setup
3. Manager Setup
CompassVPN can send metrics to a central manager for monitoring and visualization. This guide explains how to set up the manager component, which is separate from the agent that runs on your VPN server.
Manager Options
CompassVPN supports two options for metrics collection and visualization:
- Grafana Cloud (recommended for simplicity)
- Self-hosted Prometheus + Pushgateway + Grafana on Kubernetes
Choose the option that best suits your needs based on your infrastructure and requirements.
Option 1: Grafana Cloud
Grafana Cloud offers a free tier that is sufficient for monitoring several CompassVPN agents.
Step 1: Create a Grafana Cloud Account
- Go to Grafana Cloud and sign up for a free account
- Verify your email address and complete the registration process
Step 2: Create a New Connection
After creating your account, go to the following URL (replace
<your-username>with your actual Grafana Cloud username):https://<your-username>.grafana.net/connections/add-new-connection/hmInstancePromIdCreate a new token as shown in the image below:
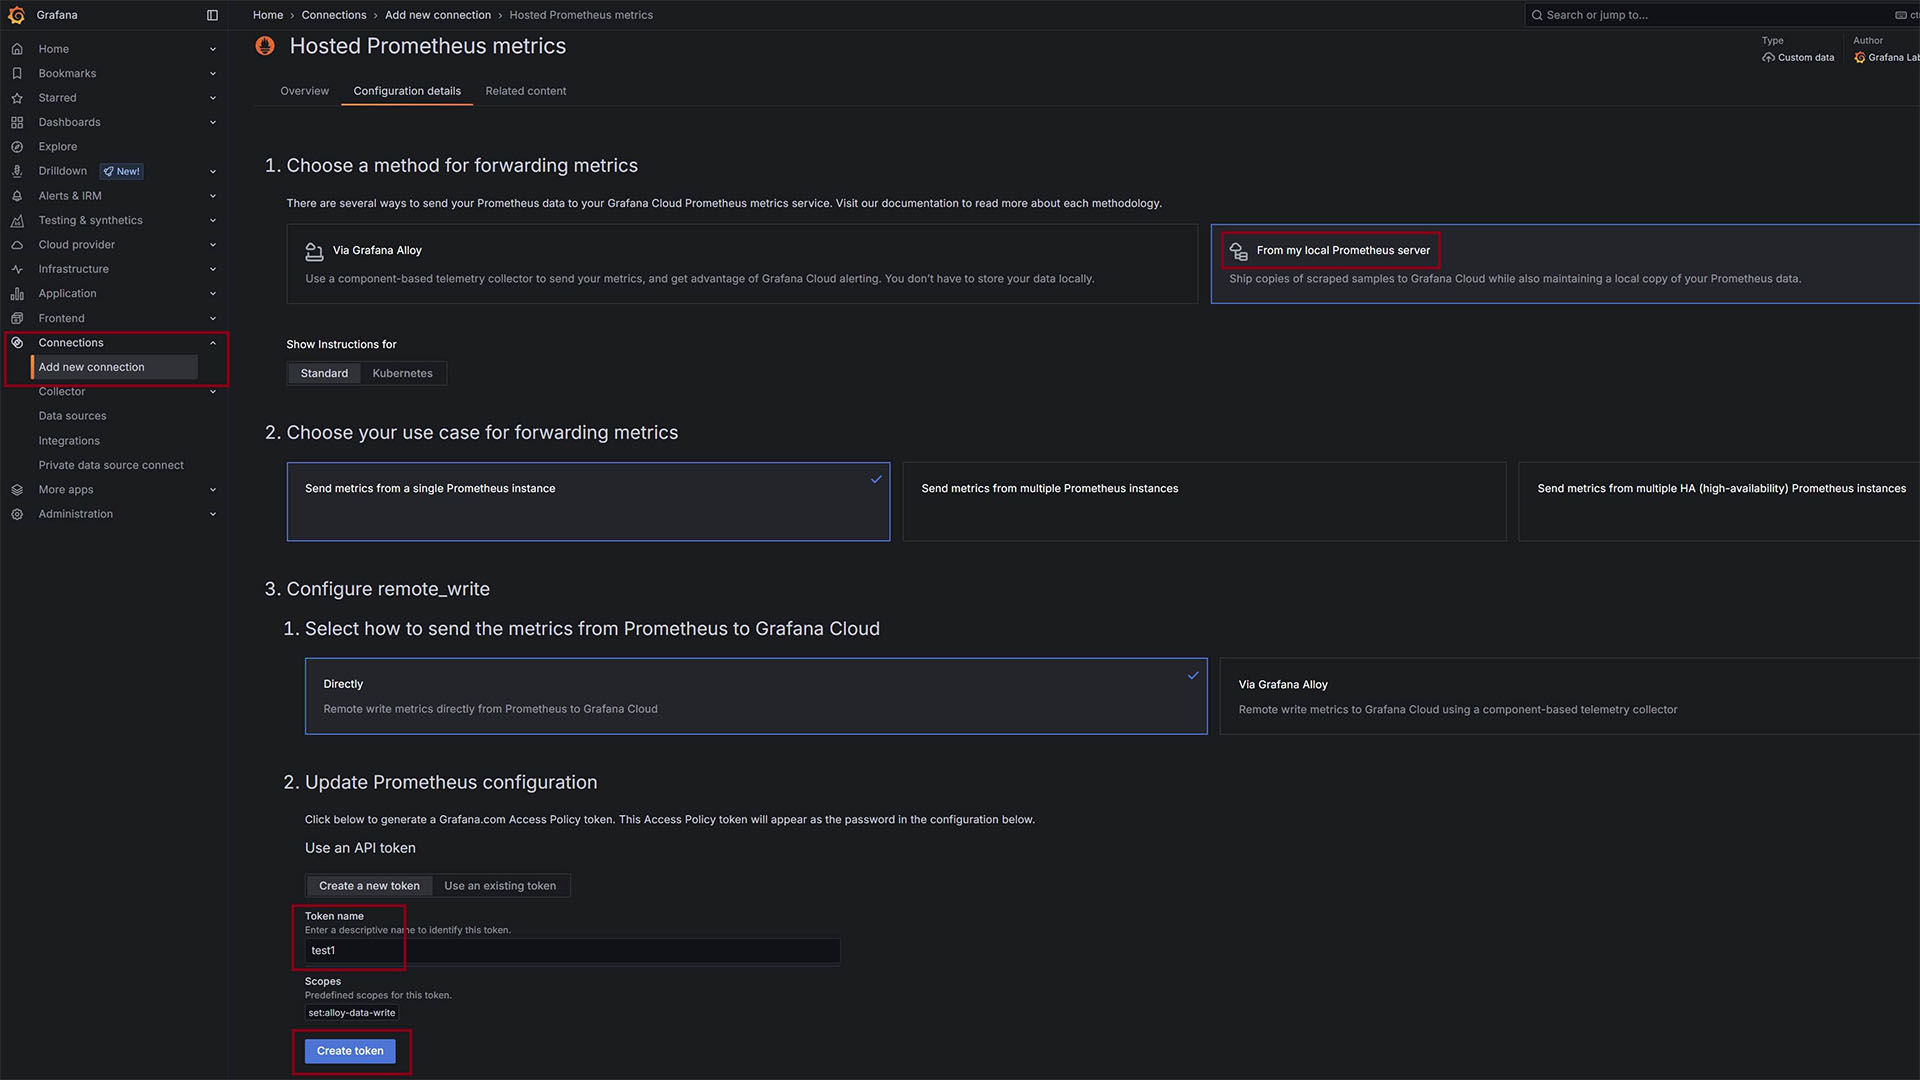
Figure 1: Creating a new connection token in Grafana Cloud.
After creating the token, you’ll see three credentials as shown below:
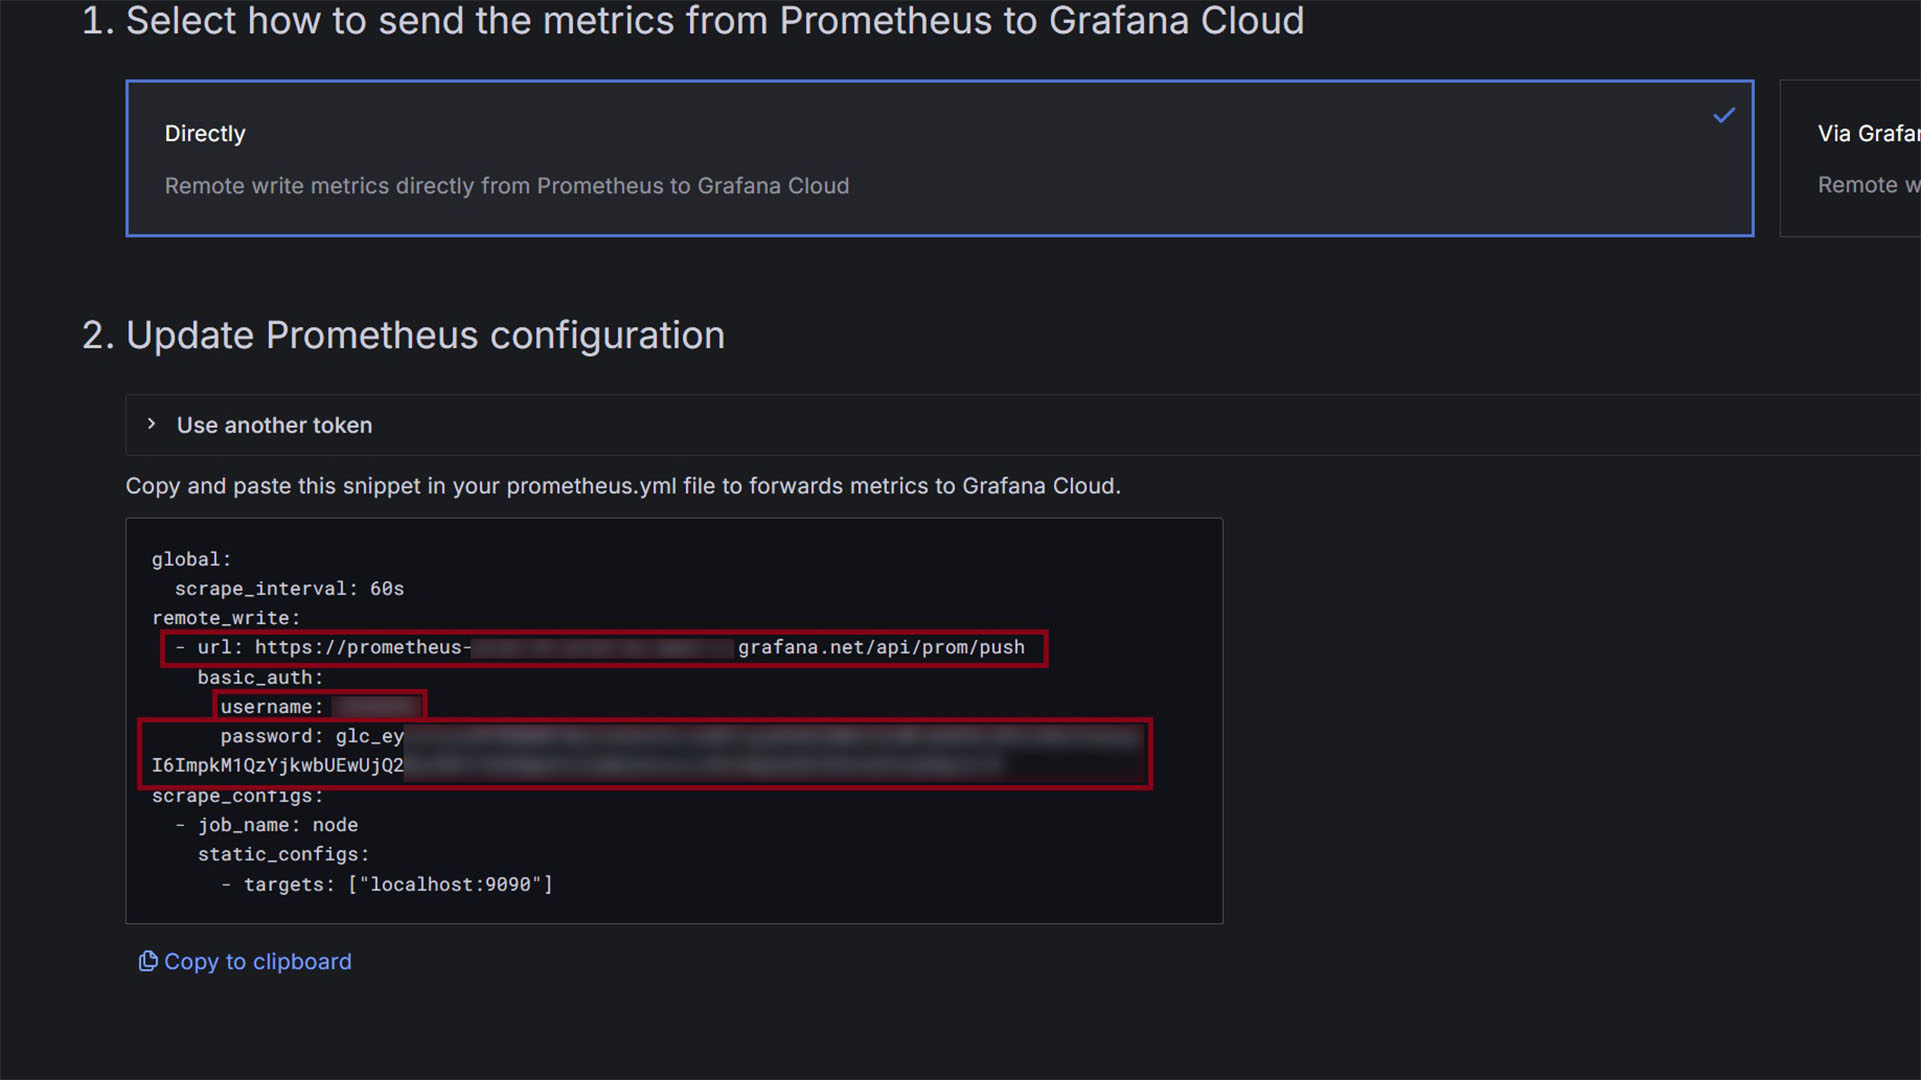
Figure 2: Copying the URL, username, and password credentials for agent configuration.
Copy these three credentials:
- URL
- Username
- Password
These will be used in your agent configuration.
Step 3: Configure CompassVPN Agent
Now, add these credentials to your CompassVPN agent’s configuration using the Web Panel:
- Access your agent’s Web Panel (refer to the Quick Start Guide if needed).
- Navigate to the Monitoring section (or similar, depending on the panel layout).
- Set the Metric Push Method to
grafana_agent. - Enter the URL, Username, and Password you copied from Grafana Cloud into the corresponding fields.
- Ensure any other required settings in the Web Panel are correctly configured.
- Click the “Save, Close & Start” button. This will save the complete configuration to the
env_fileand automatically start or restart the CompassVPN agent service.
For detailed explanations of all parameters available in the Web Panel, see the Configuration Guide .
Step 4: Import Dashboards
In Grafana Cloud, navigate to Dashboards in the left sidebar
Click the Import button
Use the following dashboard ID:
23181for CompassVPN Dashboard
Set your prometheus data source
Note: Dashboard page is available here .
Option 2: Self-hosted Kubernetes Deployment
This option gives you complete control over your monitoring stack but requires a Kubernetes cluster and more setup.
Repository Structure
The CompassVPN manager repository contains the following key components:
prometheus/- Helm chart values for Prometheusgrafana/- Helm chart values for Grafananginx-ingress-controller/- Helm chart values for NGINX Ingresscreate_auth.sh- Script to create basic authentication credentialsauth.example- Example authentication fileusers.txt.example- Example users file
Step 1: Set Up a Kubernetes Cluster
Ensure you have a running Kubernetes cluster and can retrieve the list of nodes:
kubectl get nodesStep 2: Add Required Helm Chart Repositories
helm repo add grafana https://grafana.github.io/helm-chartshelm repo add prometheus-community https://prometheus-community.github.io/helm-chartsStep 3: Create Authentication for Prometheus Pushgateway
- Create a basic authentication file using the provided script or manually:
# Create auth file using the script
./create_auth.sh

# Or manually create it
htpasswd -c auth <username>- Create a Kubernetes secret from the authentication file:
kubectl create secret generic basic-auth --from-file=authYou can refer to auth.example and users.txt.example in the repository for reference formats.
Step 4: Install Prometheus
Navigate to the prometheus directory and install using Helm:
cd prometheus/
helm install prometheus prometheus-community/prometheus -f values.yaml
Step 5: Install Grafana
Navigate to the grafana directory and install using Helm:
cd grafana/helm install grafana grafana/grafana -f values.yamlStep 6: Install NGINX Ingress Controller
Navigate to the nginx-ingress-controller directory and install using Helm:
cd nginx-ingress-controller/helm install nginx-ingress-controller oci://registry-1.docker.io/bitnamicharts/nginx-ingress-controller -f values.yamlStep 7: Configure CompassVPN Agent
Add your Pushgateway details to your CompassVPN agent’s configuration using the Web Panel:
- Access your agent’s Web Panel.
- Navigate to the Monitoring section (or similar).
- Set the Metric Push Method (
METRIC_PUSH_METHOD) topushgateway. - Enter your Pushgateway URL, Username, and Password into the corresponding fields (
PUSHGATEWAY_URL,PUSHGATEWAY_AUTH_USER,PUSHGATEWAY_AUTH_PASSWORD). - Ensure any other required settings in the Web Panel are correctly configured.
- Click the “Save, Close & Start” button. This will save the complete configuration to the
env_fileand automatically start or restart the CompassVPN agent service.
For detailed explanations of all parameters available in the Web Panel, see the Configuration Guide .
Step 8: Import Dashboards in Grafana
- Access Grafana at your configured ingress URL
- Log in with your Grafana credentials (check the Grafana Helm values for default credentials)
- Import the JSON dashboards:
- Navigate to Dashboards > Import
- Use dashboard ID
23181 - Select your Prometheus data source
- Click Import
Monitoring Multiple Agents
Both Grafana Cloud and the self-hosted solution support monitoring multiple CompassVPN agents. Each agent will be identified by its DONOR value in the env_file.
To distinguish between agents in dashboards, use the DONOR label as a filter variable.
Next Steps
After setting up your manager and configuring the agent via the Web Panel, the panel will automatically restart the agent when you use the appropriate action (Bootstrap, Restart, or Update) after saving. Metrics should start appearing in your Grafana instance shortly.
Note: Allow at least 5 minutes after the agent restarts for all logs and services to fully populate and stabilize. This ensures that metrics data starts flowing correctly to your manager.
Your CompassVPN installation is now complete and ready for use. You can access your monitoring dashboard and begin managing your VPN service through the configured interface.
For detailed information about using CompassVPN, please refer to our User Guide .